Consider a little science experiment we’ve all done, to find out if a switch controls a light. How many data points does it usually take to convince you? Not many! Even if you didn’t do a randomized trial yourself, and observed somebody else manipulating the switch you’d figure it out pretty quickly. This type of science is easy!
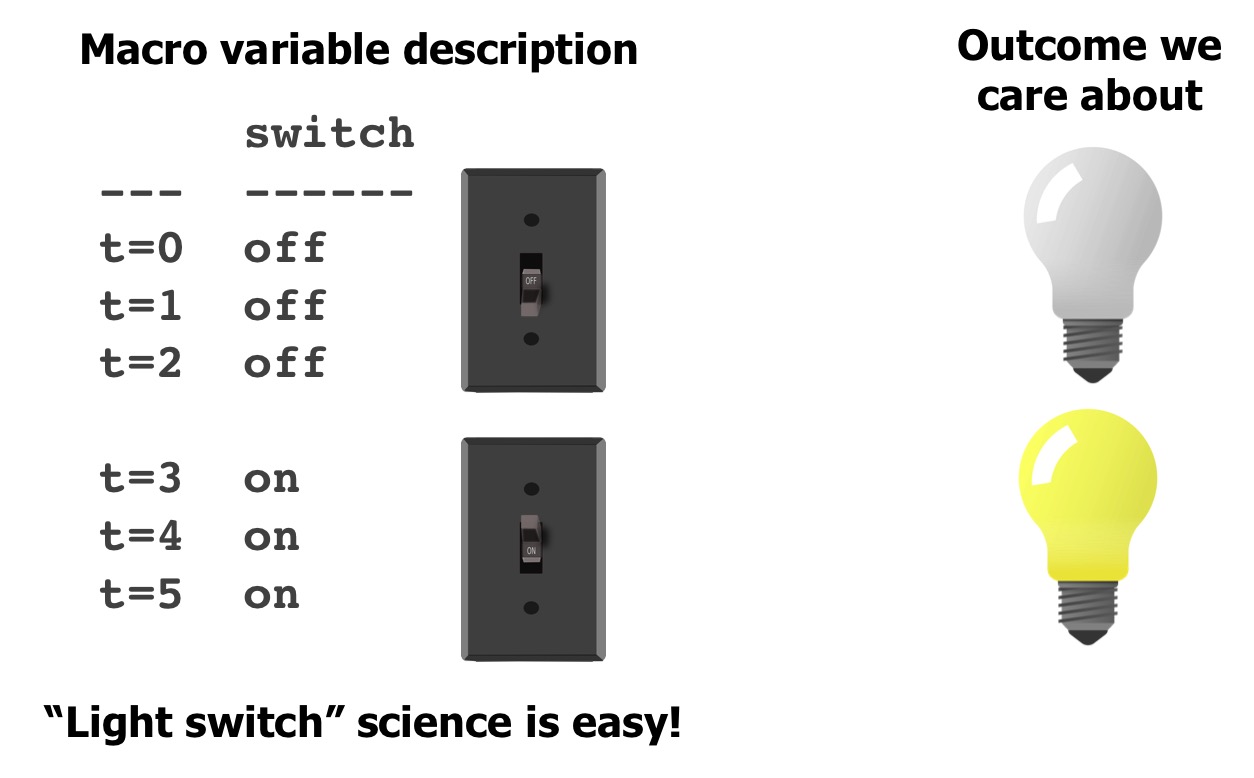
One thing that makes this easy is that you already know the right level of abstraction for the problem: what a switch is, and what a bulb is. You also have some prior knowledge, e.g. that switches typically have two states, and that it often controls things like lights. What if the data you had was actually a million variables, representing the state of every atom in the switch, or in the room?
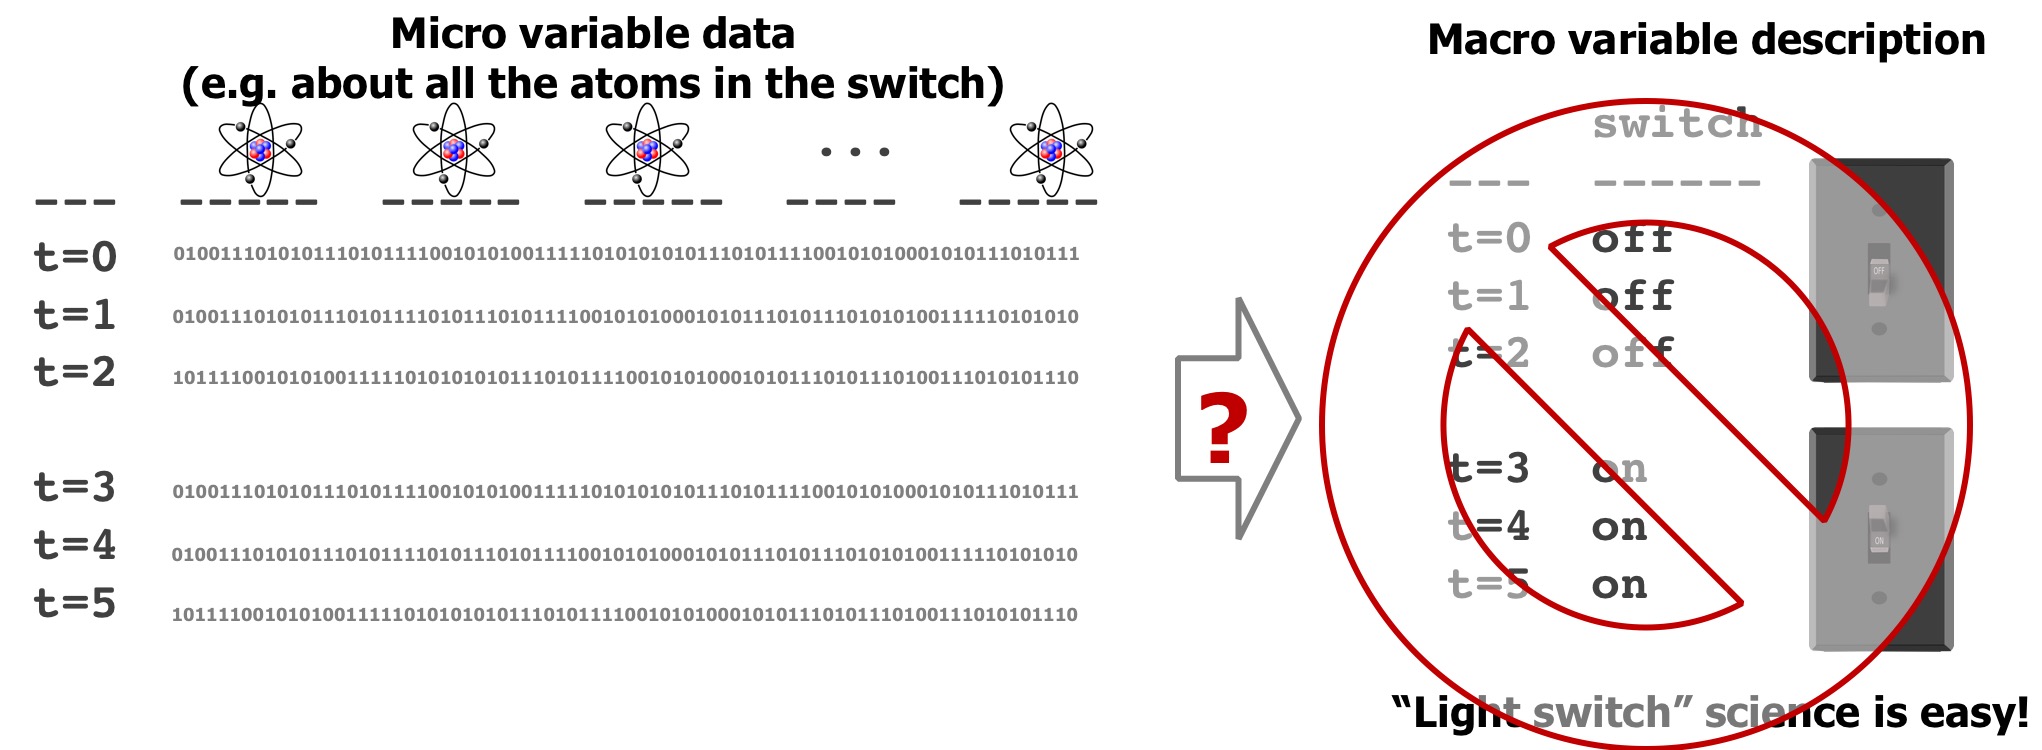
Even though, technically, this data includes everything about the state of the switch, it’s overkill and not directly useful. For it to be useful, it would be better if you could boil it back down to a “macro” description consisting of just a switch with two states. Unfortunately, it’s not very easy to go from the micro description to the macro one. One reason for this is the “curse of dimensionality”: a few samples of a million dimensional space is considered very under-sampled, and directly applying machine learning methods using this type of data typically leads to unreliable results.
As an example of another thing that could go wrong, imagine that we detect, with p<0.000001, that atom 173 is a perfect predictor of the light being on or off. Headlines immediately proclaim the important role of atom 173 in production of light. A complicated apparatus to manipulate atom 173 is devised only to reveal… nothing. The role of this atom is meaningless in isolation from the rest of the switch. And this hints at the meaning of “macro-causality” – to identify (simple) causal effects, we first have describe our system at the right level of abstraction. Then we can say that flipping the switch causes the light to go on. While there exists a causal story involving all the atoms in the switch, electrons, etc., but this is not very useful.
Social science’s micro-macro problem
Social science has a similar micro-macro problem. If we get “micro” data about every decision an individual makes, is it possible to recover the macro state of the individual? You could ask the same where the micro-variables are individuals and you want to know the state of an organization like a company.
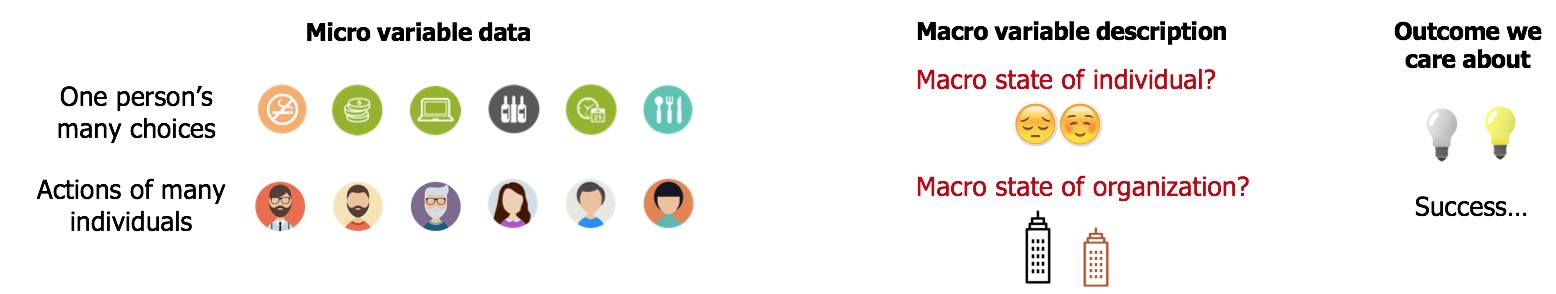
Currently, we use expert intuition to come up with macro-states. For individuals, this might be a theory of personality or mood and include states like extroversion, or a test of depression, etc. After dreaming up a good idea for a macro-state, the expert makes up some questions that they think reflect that factor. Finally, they ask an individual to answer these questions. There are many places where things can go wrong in this process. Do experts really know all the macro states for individuals, or organizations? Do the questions they come up with accurately gauge these states? Are the answers that individuals provide a reliable measure?
Most of social science is about answering the last two questions. We assume that we know what the right macro-states are (mood, personality, etc.) and we just need better ways to measure them. What if we are wrong? There may be hidden states underlying human behavior that remain unknown. This brings us back to the light switch example. If we can identify the right description of our system (a switch with two states), experimenting with the effects of the switch is easy.
Macro approaches and limitations
The mapping from micro to macro is sometimes called “coarse-graining” by physicists. Unfortunately coarse-graining in physics usually relies on reasoning based on the physical laws of the universe, allowing us, for instance, to analytically derive an expression allowing us to go from describing a box of atoms with many degrees of freedom to a simple description involving just three macro-variables: volume, pressure, and temperature.
The analytic approach isn’t going to work for social science. If we ask, “why didn’t Jane go to the party?”, an answer involving the firing of neurons in her brain is not very useful, even if it is technically correct. We want a macro-state description that gives us a a more abstract causal explanation, even if the connection with micro-states is not as clean as the ideal gas law.
There are some more data-driven approaches to coarse-graining. One of the things I work on, CorEx, says that “a good macro-variable description should explain most of the relationships among the micro-variables.” We have gotten some mileage from this idea, finding useful structure in gene expression data, social science data, and (in ongoing work) brain imaging, but it’s far from enough to solve this problem. Currently these approaches address course-graining without handling the causal aspect. One promising direction for future work is to jointly model abstractions and causality.
A long line of research sometimes called computational mechanics and developed by Shalizi and Crutchfield, among others, says that our macro-state description should be a minimal sufficient statistic for optimally predicting the future from the past. Here’s an older high-level summary and long list of other publications. One of the main problems with this approach for social science is that the sufficient statistics may not give us much insight for systems with many internal degrees of freedom. We would like to be able to structure our macro-states in a meaningful way. A similar approach also looks for compressed state space representations but focuses more on the complexity and efficiency of simulating a system using its macrostate description.
Eberhardt and Chalupka introduced me to the term “macro-causal” which they have formalized in the “causal coarsening theorem”. A review of their work using causal coarsening includes a nice example where they infer macro-level climate effects (El Nino) from micro-level wind and temperature data.
Finally, an idea that I really like but is still in its infancy is to find macro-states that maximize interventional efficiency. A good macro-state description is one that, if we manipulated it, would produce strong causal effects. Scott Aaronson gives a humorous critique of this work, “Higher level causation exists (but I wish it didn’t)“. I don’t think the current formulation of interventional efficiency is correct either, but I think the idea has potential.
It’s hard to be both practical and rigorous when it comes to complex systems involving human behavior. The most successful example of discovering a macro-causal effect, I think, comes from the El Nino example but this is still relatively easy compared to the problems in social science. In the climate case, they were able to restrict the focus to homogeneous array of sensors in an area where we expect to find only a small number of relevant macro-variables. For humans, we get a jumble of missing and heterogeneous data and (intuitively) feel that there are many hidden factors at play even in the simplest questions. These challenges guarantee lots of room for improvement.
Filed under: Posted by Greg Ver Steeg | 2 Comments
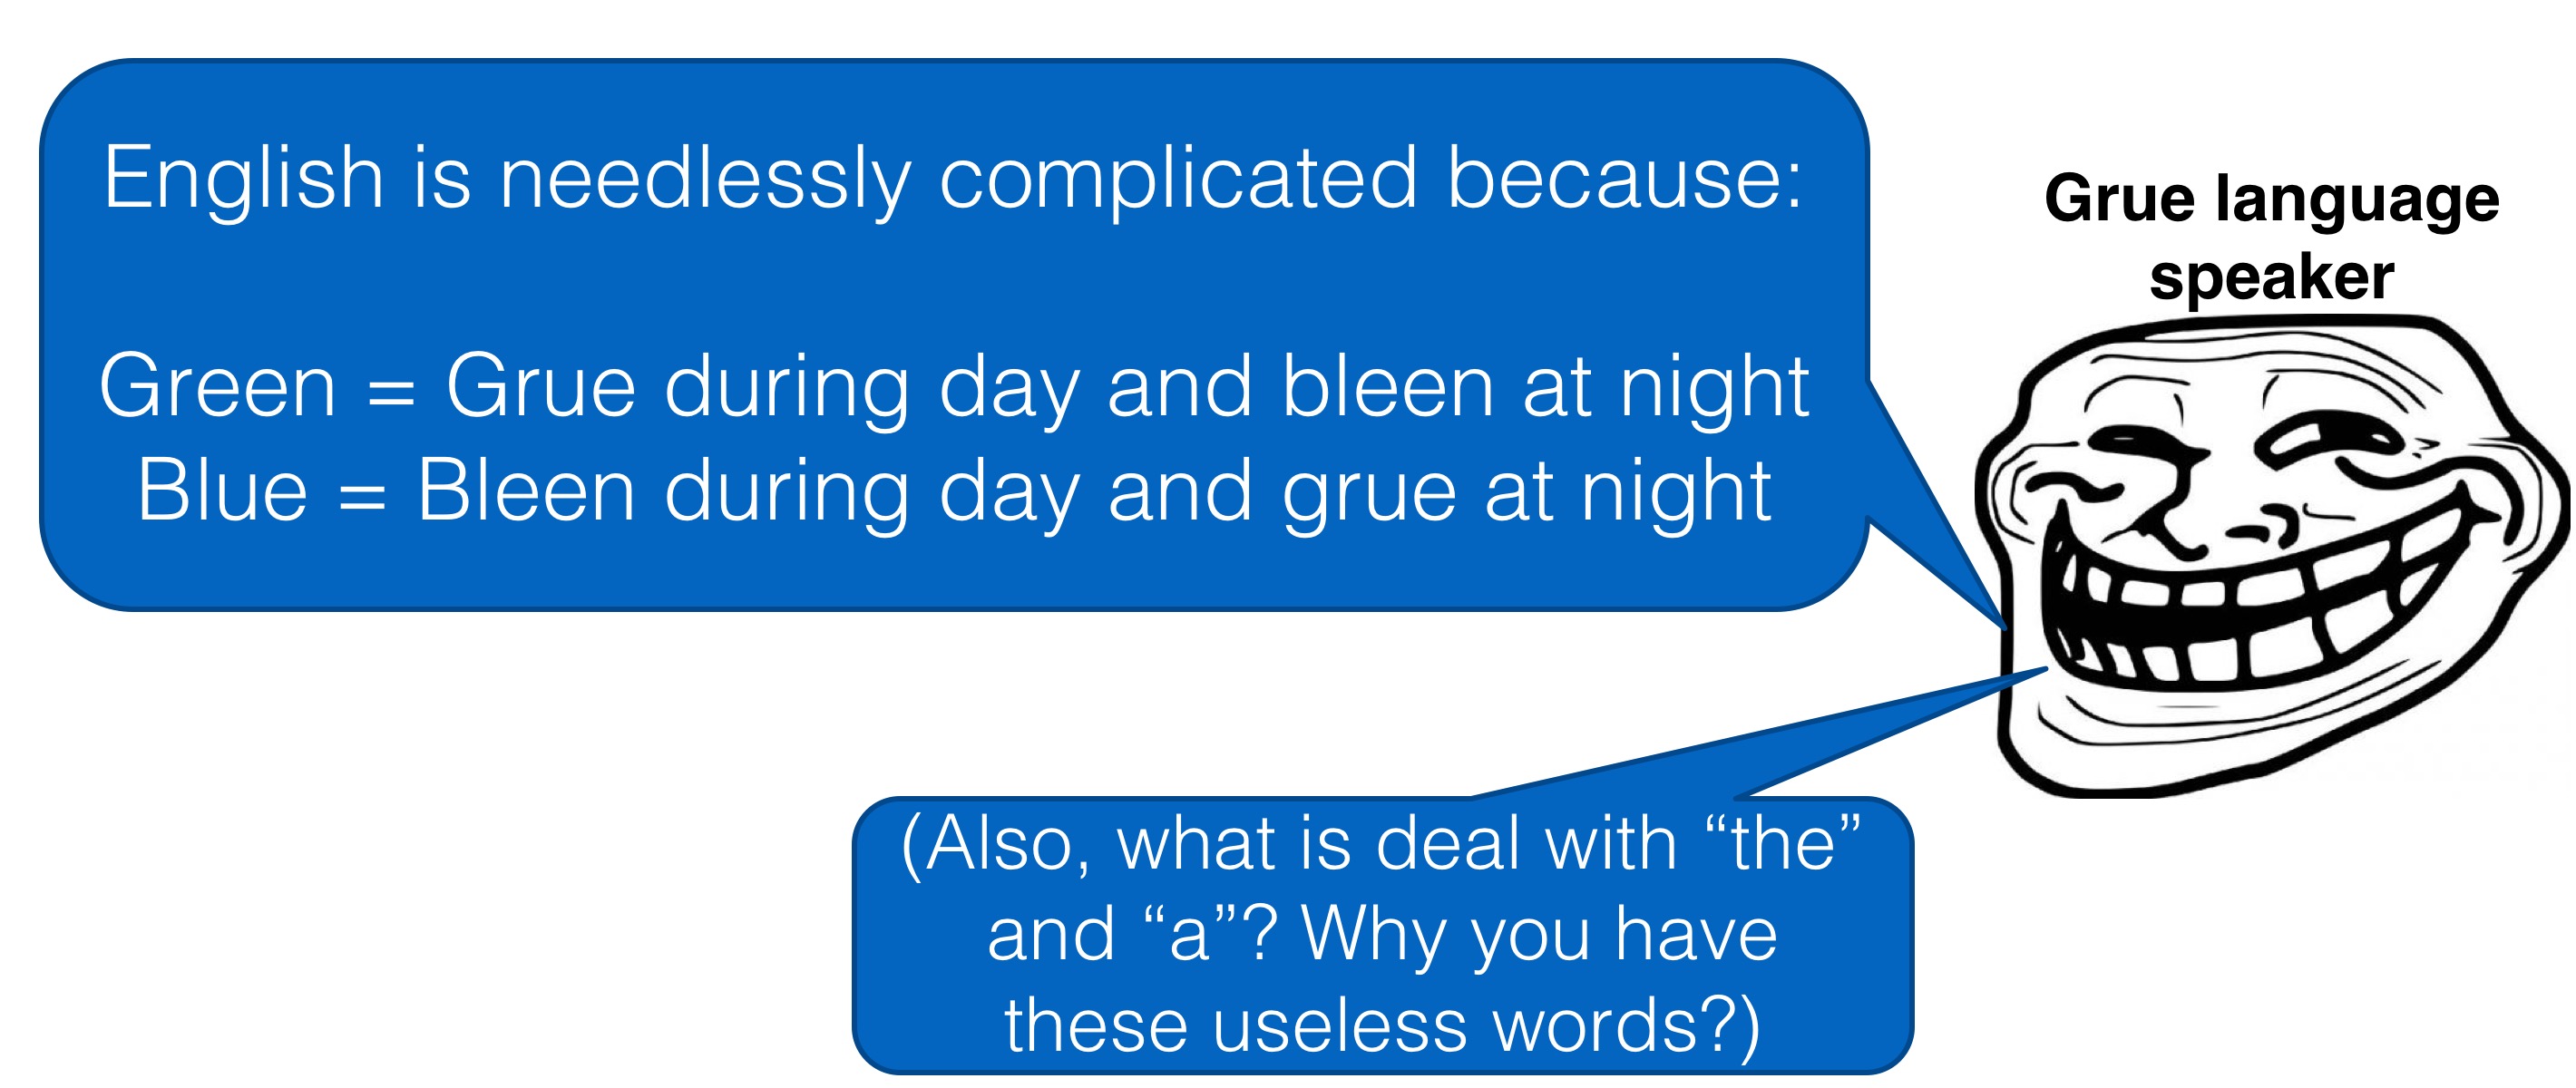
The Grue language doesn’t have words for “blue” or “green”. Instead Grue speakers have the following concepts:
grue: green during the day and blue at night
bleen: blue during the day and green at night

(This example is adapted from the original grue thought experiment.) To us, these concepts seem needlessly complicated. However, to a Grue speaker, it is our language that is unnecessarily complicated. For him, green has the cumbersome definition of “grue during the day and bleen at night”.
How can we wipe the smug smile off this Grue speaker’s face, and convince him of the obvious superiority of our own concepts of blue and green? What we do is sneak into his house at night and blindfold and drug the Grue speaker. We take him to a cave deep underground and leave him there for a few days. When he wakes up, he has no idea whether it is day or night. We remove his blindfold and present him with a simple choice: press the grue button and we let him go, but press the bleen button… Now he’s forced to admit the shortcomings of “grue” as a concept. By withholding irrelevant extra information (the time of day), grue does not provide any information about visual appearance. Obviously, if we told him to press the green button, he’d be much better off.
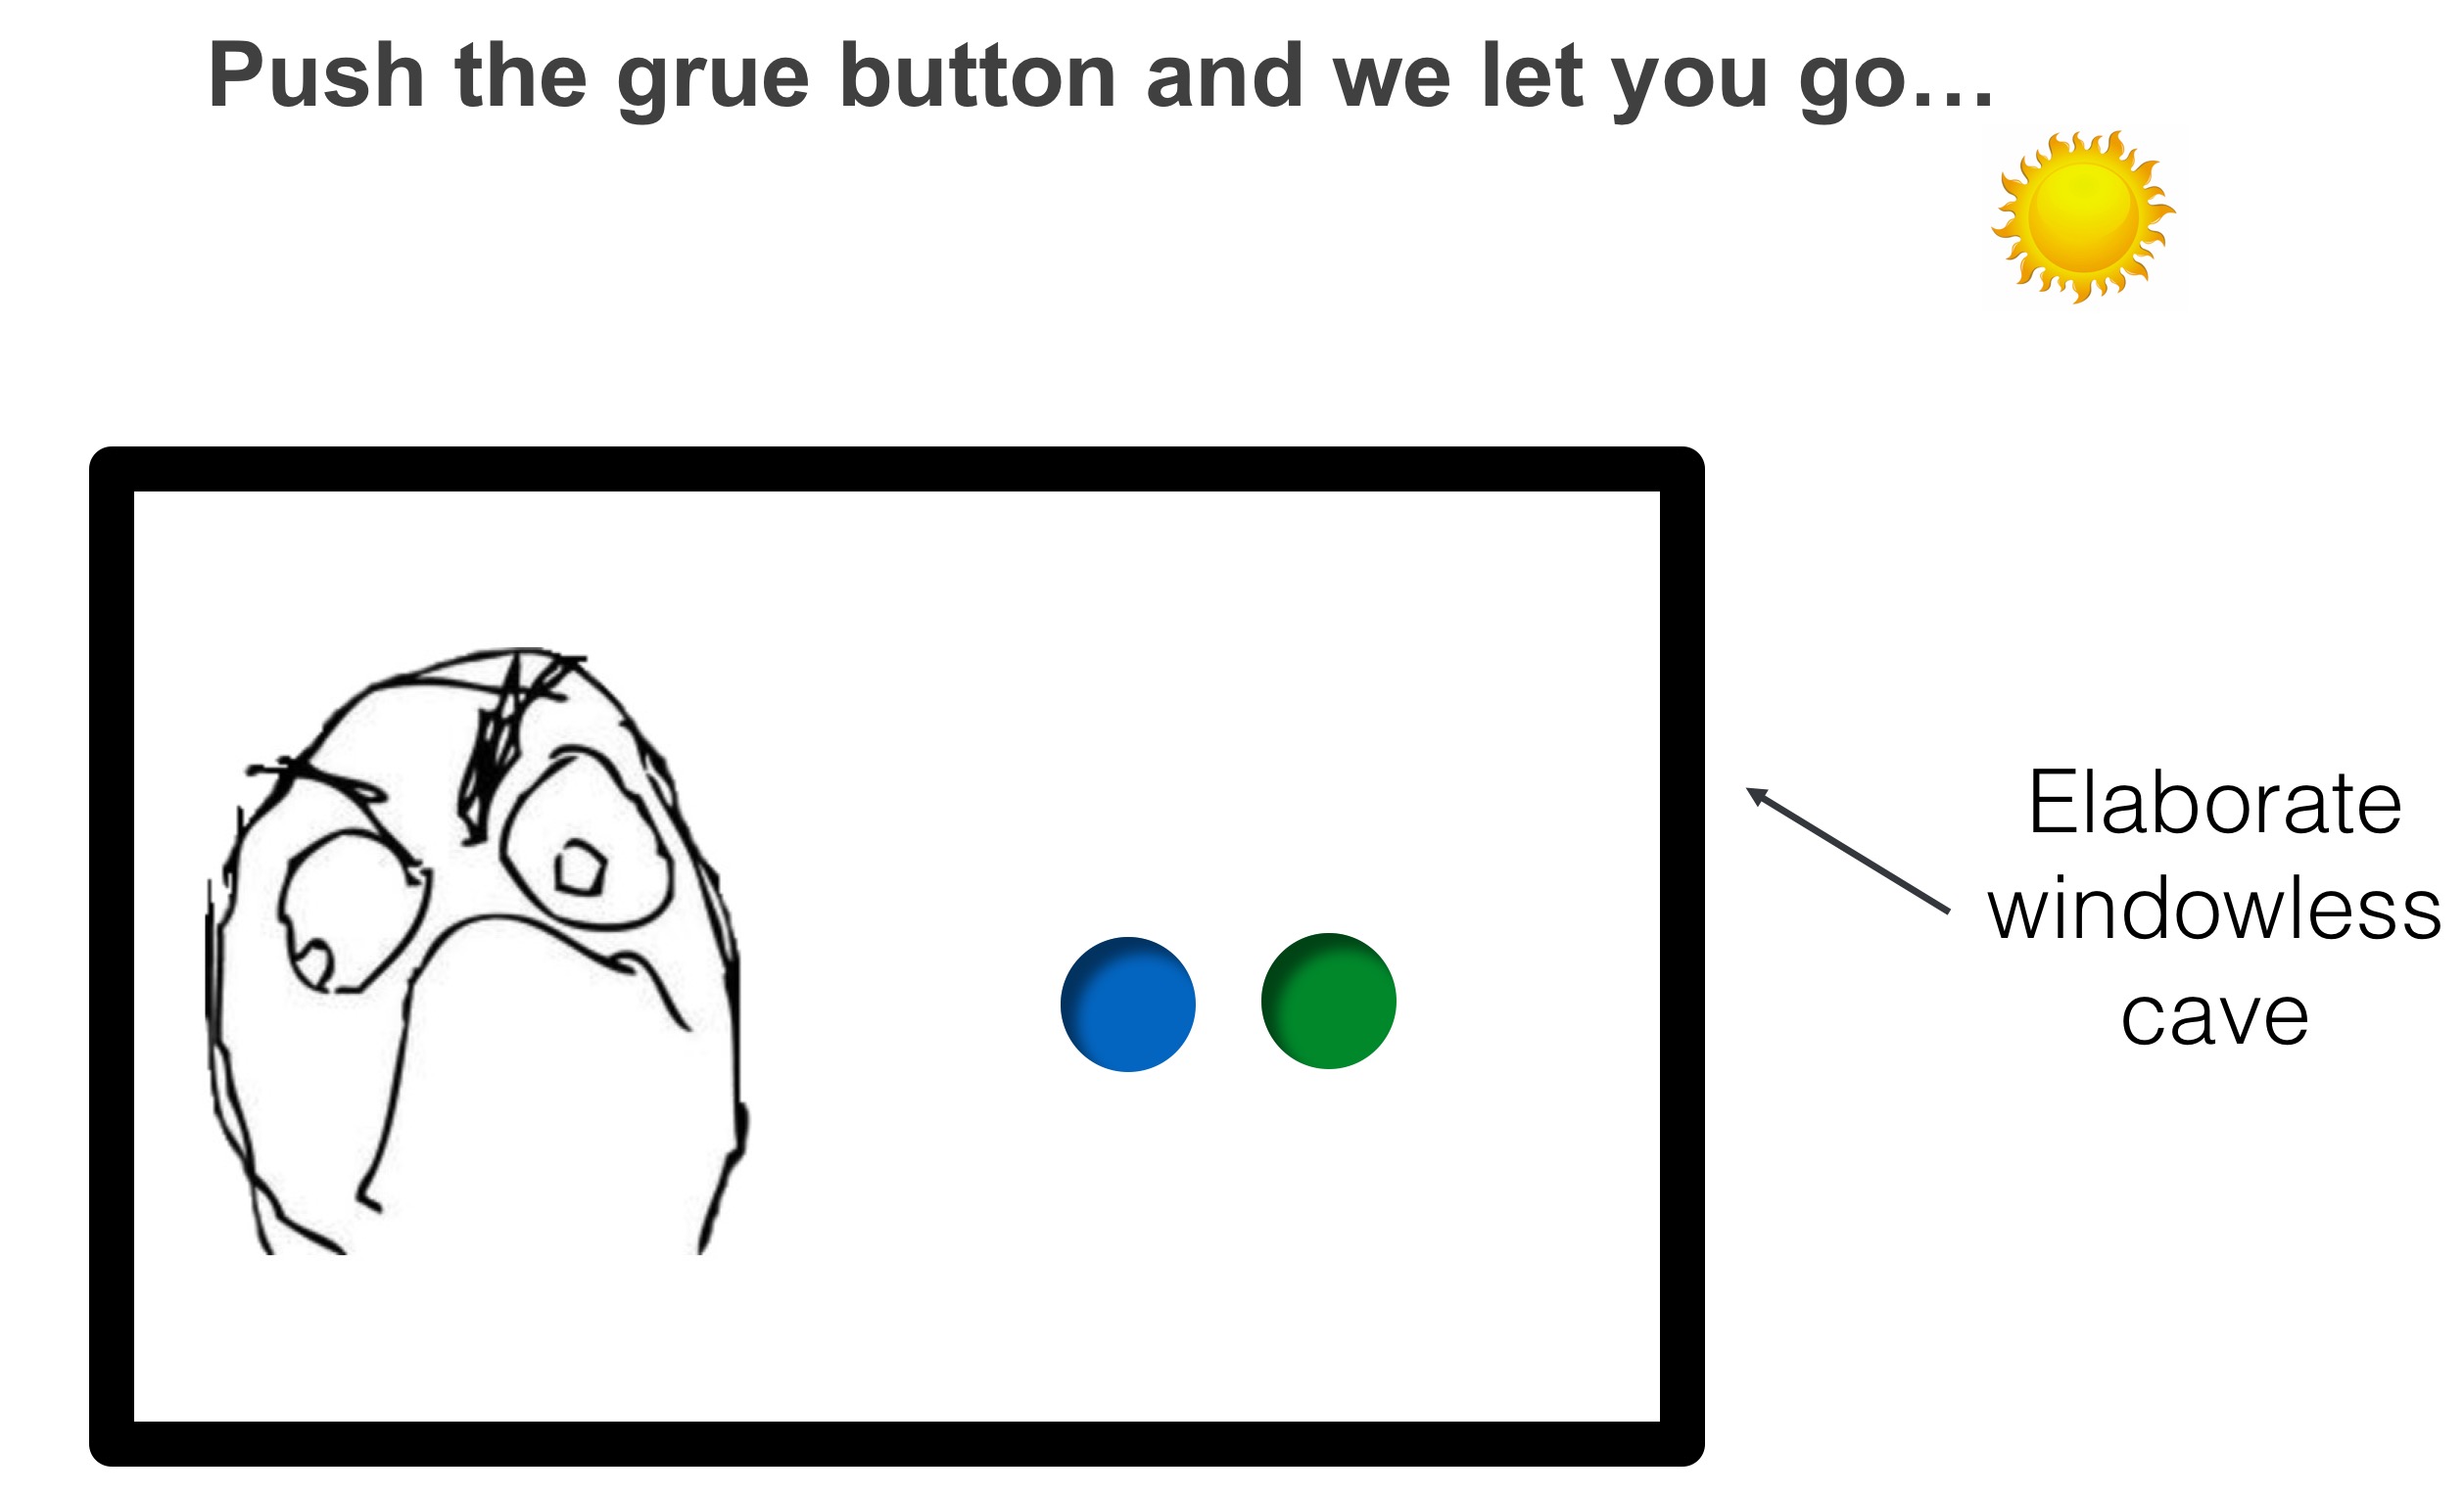
We say that grue-ness and time of day exhibit “informational synergy” with respect to predicting the visual appearance of an object. Synergy means the “whole is more than the sum of the parts” and in this case, knowing either the time of day or the grue-ness of an object does not help you predict its appearance, but knowing both together gives you perfect information.
Grues in deep learning
This whimsical story is a very close analogy for what happens in the field of “representation learning”. Neural nets and the like learn representations of some data consisting of “neurons” that we can think of as concepts or words in a language, like “grue”. There’s no reason for generic deep learners to prefer a representation involving grue/bleen to one with blue/green because either will have the same ability to make good predictions. And so most learned representations are synergistic and when we look at individual neurons in these representations they have no apparent meaning.
The importance of interpretable models is becoming acutely apparent in biomedical fields where blackbox predictions can be actively dangerous. We would like to quantify and minimize synergies in representation learning to encourage more interpretable and robust representations. Early attempts to do this are described in this paper about synergy and another paper demonstrates some benefits of a less synergistic factor model.
Revenge of the Grue
Now, after making this case, I want to expose our linguo-centrism and provide the Grue apologist’s argument, adapted from a conversation with Jimmy Foulds. It turns out the Grue speakers live on an island that has two species of jellyfish: a bleen-colored one that is deadly poisonous and a grue-colored one which is delicious. Since the Grue people encounter these jellyfish on a daily basis and their very lives are at stake, they find it very convenient to speak of “grue” jellyfish, since in the time it takes them to warn about a “blue during the day but green at night jellyfish”, someone could already be dead. This story doesn’t contradict the previous one but highlights an important point. Synergy only makes sense with respect to a certain set of predicted variables. If we minimize synergies in our mental model of the world, then our most common observations and tasks will determine what constitutes a parsimonious representation of our reality.
Acknowledgments
I want to thank some of the PhD students who have been integral to this work. Rob Brekelmans did many nice experiments for the synergy paper. He has provided code for the character disentangling benchmark task in the paper. Dave Kale suggested key aspects of this setup. Finally Hrayr Harutyunyan has been doing some amazing work in understanding and improving on different aspects of these models. The code for the disentangled linear factor models is here, I hope to do some in depth posts about different aspects of that model (like blessings of dimensionality!).
Filed under: Posted by Greg Ver Steeg | 2 Comments
Gene expression updates
The work with Shirley Pepke on using CorEx to find patterns in gene expression data is finally published in BMC Medical Genomics.
Shirley wrote a blog post about it as well. She will present this work at the Harvard Precision Medicine conference and we’ll both present at Berkeley’s Data Edge conference.
The code we used for the paper is online. I’m excited to see what people discover with these techniques, but I also can see we have more to do. If speed is an issue (it took us two days to run on a dataset with 6000 genes… many datasets can have an order of magnitude more genes), please get in touch as we have some experimental versions that are faster. We are also working on making the entire analysis pipeline more automated (i.e. connecting discovered factors with known biology and visualizing predictive factors.)
Filed under: Posted by Greg Ver Steeg | Leave a Comment
Cancer in the time of algorithms
Edit: Also check out the story by the Washington Post and on cancer.gov.
Shirley is a collaborator of mine who works on using gene expression data to get a better understanding of ovarian cancer. She has a remarkable personal story that is featured in a podcast about our work together. I laughed, I cried, I can’t recommend it enough. It can be found on itunes and on soundcloud (link below).
As a physicist, I’m drawn towards simple principles that can explain phenomena that look complex. In biology, on the other hand, explanations tend to be messy and complicated. My recent work has really revolved around trying to use information theory to cut through messy data to discover the strongest signals. My work with Shirley applies this idea to gene expression data for patients with ovarian cancer. Thanks to Shirley’s amazing work, we were able to find a ton of interesting biological signals that could potentially have a real impact on treating this deadly disease. You can see a preprint of our work here.
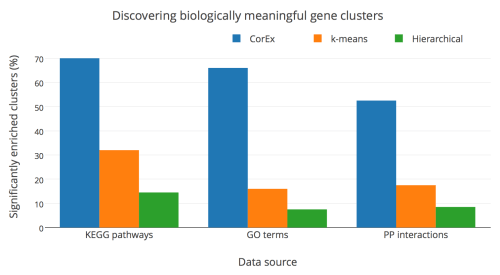
I want to share one quick result. People often judge clusters discovered in gene expression data based on how well they recover known biological signals. The plot below shows how well our method (CorEx) does compared to a standard method (k-means) and a very popular method in the literature (hierarchical clustering). We are doing a much better job of finding biologically meaningful clusters (at least according to gene ontology databases), and this is very useful for connecting our discovery of hidden factors that affect long-term survival to new drugs that might be useful for treating ovarian cancer.
Filed under: Posted by Greg Ver Steeg | 2 Comments
Here’s one way to solve a problem. (1) Visualize what a good solution would look like. (2) Quantify what makes that solution “good”. (3) Search over all potentials solutions for one that optimizes the goodness.
I like working on this whole pipeline, but I have come to the realization that I have been spending too much time on (3). What if there were a easy, general, powerful framework for doing (3) that would work pretty well most of the time? That’s really what tensorflow is. In most cases, I could spend some time engineering a task-specific optimizer that will be better, but this is really premature optimization of my optimization and, as Knuth famously said: “About 97% of the time, premature optimization is the root of all evil”.
Filed under: Posted by Greg Ver Steeg | 1 Comment
ICML 2016 slides
Here are the slides from my talk yesterday at ICML.
The information sieve is introduced in this paper. But in this followup paper, we make it really practical and demonstrate the connections to “common information”.
The code is on github for the discrete and continuous versions.
Filed under: Posted by Greg Ver Steeg | Leave a Comment
Psychedelic starfish

This one is just for fun. There’s no deeper meaning, just a failed experiment that resulted in some cool looking pictures.
Filed under: Posted by Greg Ver Steeg | 1 Comment
The Information Sieve
You have just eaten the most delicious soup of your life. You beg the cook for a recipe, but soup makers are notoriously secretive and soup recipes are traditionally only passed on to the eldest heir. Surreptitiously and with extreme caution, you pour some soup into a hidden soup compartment in your pocket.

When you get back to your mad laboratory, you begin reverse engineering the soup using an elaborate set of sieves. You pour the soup through the first sieve which has very large holes. “Eureka! The first ingredient is an entire steak.” Pleased with yourself, you continue by pouring the soup through the next sieve with slightly smaller holes. “Mushrooms, of course!” You continue to an even smaller sieve, “Peppers, I knew it!”. Since it is not a just a laboratory, but a mad laboratory, you even have a set of molecular sieves that can separate the liquid ingredients so that you are able to tell exactly how much salt and water are in the soup. You publish the soup recipe on your blog and the tight-lipped chef is ruined and his family’s legacy is destroyed. “This is for the greater good,” you say to yourself, somberly, “Information wants to be free.”
This story is the allegorical view of my latest paper, “The Information Sieve“, which I’ll present at ICML this summer (and the code is here). Like soup, most data is a mix of different things and we’d really like to identify the main ingredients. The sieve tries to pull out the main ingredient first. In this case, the main ingredient is the factor that explains most of the relationships in the data. After we’ve removed this ingredient, we run it through the sieve again, identifying successively more subtle ingredients. At the end, we’ve explained all the relationships in the data in terms of a (hopefully) small number of ingredients. The surprising things are the following:
- We can actually reconstruct the “most informative factor”!
- After we have identified it, we can say what it means to “take it out”, leaving the “remainder information” intact.
- The third surprise is negative: for discrete data, this process is not particularly practical (because of the difficulty of constructing remainder information). However, an exciting sequel will appear soon showing that this is actually very practical and useful for continuous data.
Update: The continuous version is finally out and is much more practical and useful. A longer post on that will follow.
Filed under: Posted by Greg Ver Steeg | Leave a Comment
Shannon’s bandwagon

Shannon’s birthday has passed, but I thought I would jump on the bandwagon late, as usual. Shannon himself recognized that information theory was so compelling that it encouraged over-use. He wrote an article saying as much way back in the 50’s.
It will be all too easy for our somewhat artificial prosperity to collapse overnight when it is realized that the use of a few exciting words like information, entropy, redundancy do not solve all of our problems”
-Shannon
As a researcher who tries to use information theory far beyond the domains for which it was intended, I take this note of caution seriously. Information as defined in Shannon’s theory has quite a narrow (but powerful!) focus on communication between two parties, A and B. When we try apply information theory to gene expression, neuroimaging, or language, we have many, many variables and there is not an obvious or unique sense of what A and B should be. We don’t really have a complete theory of information for many variable systems, but I think that is where this bandwagon is headed.
Filed under: Posted by Greg Ver Steeg | Leave a Comment
The Truth Is Out There

As a child, I was visited by an alien. I remember the sensation of not being able to move or speak and seeing this other-worldly face. Some time later, when I saw a documentary about people who had been visited by aliens, I felt a chill of recognition. Their experiences matched my own.
People all over the world describe the appearance of aliens in a similar way, and this is often cited as proof that they are among us. I think that there is a different and more plausible explanation for the universality of this phenomena.
The alien image above was generated automatically from a collection of human faces. How was that done? Basically, I train some “neurons” to capture as much information about human faces as possible. These neurons try to split up the work in an optimal way, and robustly we see a neuron that represents the alien face. When you add this together with a few other informative facial features, you can flexibly recognize many types of faces. Seeing this pattern causes a strong sense of recognition because it activates core features in our facial recognition circuitry. However, having this neuron fire by itself is unnatural – no human face would cause just this one pattern to fire without any accompanying ones. Therefore it also strikes us as alien.
Dreams and drugs cause random firing patterns that sometimes activate unusual combinations of our facial recognition circuitry. The universality of people’s perceptions of alien faces only reflects the universal principles underlying the circuits in our head. Now we just have to reconstruct these principles: the truth is out there (in here?).
Filed under: Posted by Greg Ver Steeg | Leave a Comment
